A real-world practical deep dive into creating a simple but valuable custom solution in Azure Log Analytics. The focus is hooking up a common and popular firewall product from Fortinet, Inc. with an Azure Log Analytics workspace to gain insight and affect control into the Internet traffic through the firewall. This article is for organizations with syslog-equipped firewalls they would like to manage better, and that already have (or are OK with establishing) an Azure Log Analytics workspace as a destination for their firewall syslog data.
Solving a Real Problem with website publishing
A recent low disk condition on a web server discovered many gigabytes of “IIS” web logs documenting months of attempts from Internet sources trying to blindly guess their way to higher access. The logs had grown to almost fill the server hard drive. The small location has only web and SMTP published with no commercial traffic, yet just having any web server on the Internet attracts a vast array of scoundrels.

Figure 1 – Typical web hacker/hostile log profile: Different client stacks, from the same foreign IP address, probing for common attack surfaces.
Figure 1 shows the IIS logs of a typical hacking or otherwise hostile probe attempt. Here is a legend of what’s happening:
- The same Internet IP address (in green) sends requests from two ‘browser’ clients one minute apart (Windows XP in blue, then Ubuntu X11 in orange).
- The requests are for well-known exploitable, specific server-side scripts (in red). (None of these paths existed on the lab server, thus the 404 Not Found code is returned.)
The small site where the IIS server is located needs to receive some web traffic from the Internet, as well as the ability to send and receive email, so full Internet isolation is not an option. It just seems a shame to waste so much processing and logging resources on ‘server spam’. Not to mention the risk of having the exposure of being constantly probed for security lapses.
Firewall products and Azure Log Analytics
The FortiGate and FortiWifi firewalls from Fortinet, Inc. featured in this solution are popular with small, medium, and large enterprises. Fortinet has its own management toolset named FortiAnalyzer. The management product is extra cost and not included with the firewall product. Fortinet competes with Cisco, Palo Alto Networks, WatchGuard, Sonic Wall, Barracuda, and Juniper for the enterprise firewall market.
Many or most of these vendors’ products support the syslog protocol features in this solution. The selections of query variables in this solution are specific to the Fortinet products and the small site environment described in this article. However any firewall supporting syslog can connect to Azure Log Analytics in the same manner described here. The development of the proper rule and query set for your environment is not time consuming once data is flowing in.
Just as all Fortinet customers don’t have a FortiAnalyzer, not all firewall owners have Azure subscriptions with Log Analytics workspaces. Those that do may have an existing Security information and event management (SIEM) product and have good insight already into Internet traffic and control. There are a lot of supported and valuable scenarios with Azure Log Analytics both as a destination for, and as a supplier of enterprise log data.
Connecting your firewall to Azure Log Analytics
A piece of infrastructure you will need to deploy in your environment is a syslog forwarder (a Linux computer) to connect your firewall with Azure Log Analytics. The Linux computer is often deployed as a virtual appliance (VM) on-premises, or any cloud location that the syslog-generating firewall(s) can communicate with. For details on how to deploy and configure the Linux forwarder, see my previous article. The Linux forwarder can be on-premises physically near the firewall, or it can be located in Azure or another cloud, connected to your firewall by an IPSEC tunnel as seen in Figure 2. In either scenario, the Linux computer has a Log Analytics agent configured to communicate with your Log Analytics workspace.
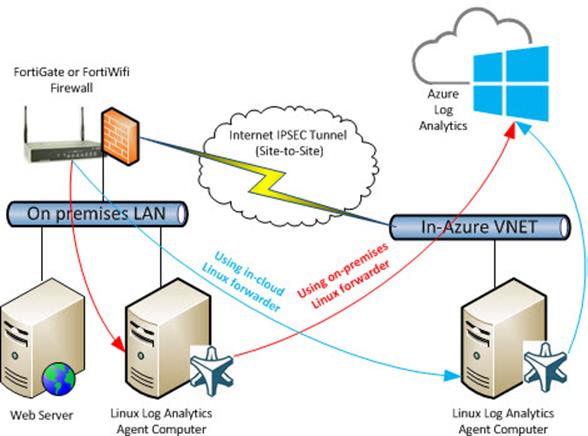
Figure 2 – Two routes for connecting the firewall to Azure Log Analytics. The IPSEC Tunnel is only necessary when using an in-cloud forwarder.
Figure 2 shows a FortiWifi connected to Azure Log Analytics in two possible scenarios:
- Using an on-premises Linux computer for syslog forwarding (red path in Figure 2).
- Using an in-cloud Linux computer for syslog forwarding, connected by IPSEC site to site VPN tunnel to the firewall (blue path). (For customers with an Azure ExpressRoute connection, this is equivalent.)
Setup syslog in your firewall
Configure your firewall to use the Linux computer as its syslog destination as shown in Figure 3:
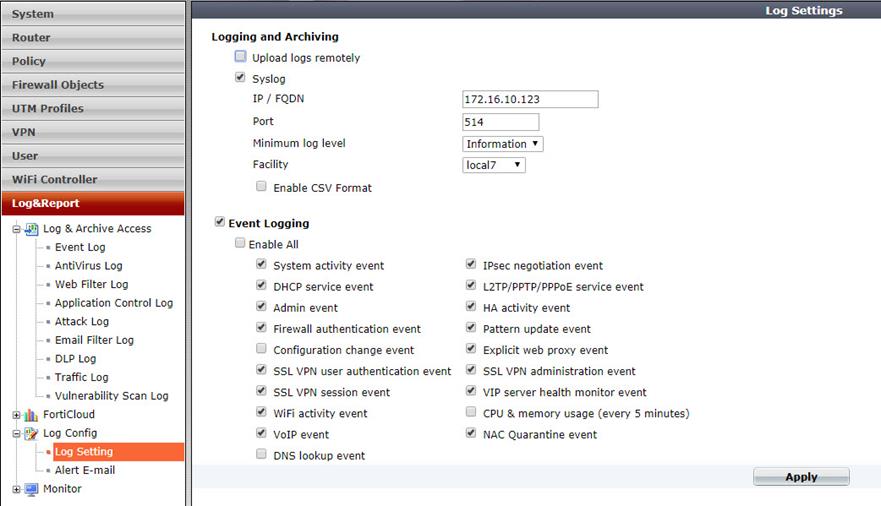
Figure 3 – Configure the firewall to use the Linux syslog forwarder.
In the case of the FortiGate firewall, the Facility code can be set to any available value (local7 is used as seen in Figure 3). This value is reported to Azure Log Analytics and can be useful in tracking log events in searches.
Fortigate syslog solution for Azure Log Analytics
Once your firewall is connected to Azure Log Analytics you should create a custom dashboard solution that suits your needs. You will have excellent visibility and gain a lot of insight into your firewall operation by studying the collected and indexed syslog data in the Log search feature of the Azure portal. You will notice which types of data your firewall is delivering and learn what to monitor to meet your business and security needs.
I developed for this article an Azure Log Analytics pre-built solution you can download from github:
https://github.com/john-joyner/Fortigate-syslog-solution-for-Azure-Log-Analytics
Figure 4 shows the solution’s top level tile in the Azure Log Analytics overview dashboard page (as well as the Azure Monitor Overview page):
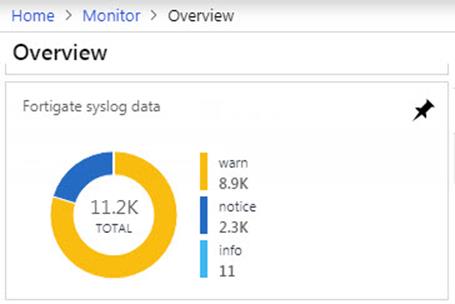
Figure 4 – Solution Tile: FortiGate firewall syslog messages surfaced in Azure Log Analytics dashboard.
The solution locates your FortiGate and FortiWifi devices by their serial numbers which are always reported as the “device_id” in syslog messages. Device_ids beginning with FTG and FWF are provided for.
Tip
If you have other Fortinet devices with different serial number patterns (besides FWF or FGT) you can modify this search parameter wherever found in the solution with your additional or different parameters:
| where (SyslogMessage contains “device_id=FWF”) or (SyslogMessage contains “device_id=FGT”)
Figure 5 shows some of the visualization parts in the solution blade after you click on the solution tile. In the center syslog messages are tracked by their severity type, basically Notice for approved traffic and Warn for denied traffic. Notice on the right we are able to track firewall traffic by protocol (HTTP, HTTPS, or SMTP). Other parts in the blade (not shown) offer up a detailed analysis on syslog severity types by time, and a list of discovered FortiGate devices.
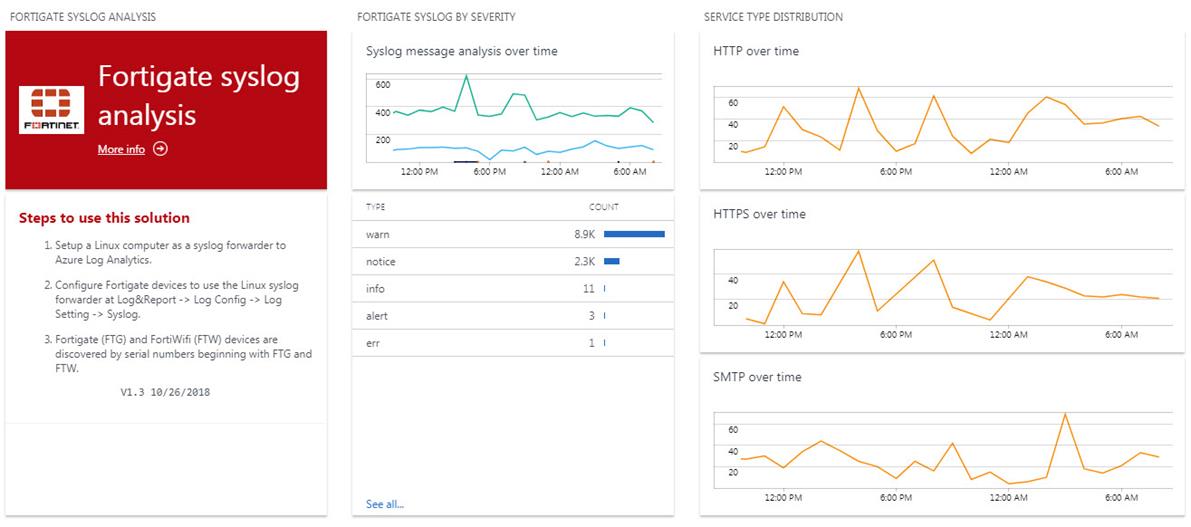
Figure 5 – Solution visualization parts: FortiGate syslog messages over time by severity and by service type.
When you select a chart of interest from the solution visualization parts, you can pivot to a log view like that seen in Figure 6 and inspect the full “raw” syslog message content. Figure 6 is a Notice type event indicating successful access. The SyslogMessage portion of the event lists all details about the firewall access. All these details are available for indexing and alerting.
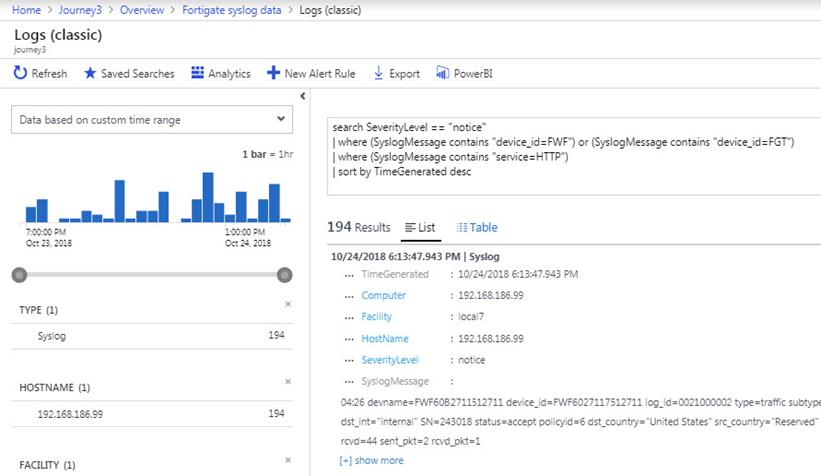
Figure 6 – Solution visualization parts: Using Log Analytics queries to focus on data of interest, in this example, successful HTTP access.
Taking it to the next level: Azure Log Analytics for Security Analysis
So far this article has described a method to elevate the operational status of your firewall into the Azure portal–providing metrics on the performance of the firewall that will help you spot a deviance from normal, and investigate further.
Azure Log Analytics informs geo-blocking firewall web publishing rules
Another valuable scenario leverages Azure Log Analytics and Azure Monitor Alerts to guide and manage your security decisions. In the real-world situation described in this article, it may be observed that many unwanted web accesses came from outside the local country. A great feature of the FortiGate firewall is the ability to block traffic based on country of origin (geography). However it’s not possible to ‘white-list’ only the local country, rather you need to block each non-local country individually.
To avoid unnecessarily creating blocks for every country on the planet except for a few (too many block rulesets could impact firewall performance), it seems optimal to only block those countries proven to be a source of undesired traffic. An Azure Monitor alert to let you know when non-local country access has occurred lets you make a decision to add or not add that country to your ‘block list’.
The following Log Analytics query of syslog messages returns successful (“notice”) events when the source country is not the local country (“United States” in this example):
Syslog
| where (SyslogMessage contains “device_id=FWF”) or (SyslogMessage contains “device_id=FGT”) |
| where SeverityLevel == “notice”
| where SyslogMessage notcontains “src_country=”United States”” and SyslogMessage notcontains “subtype=ipsec” and SyslogMessage notcontains “subtype=pattern” and SyslogMessage notcontains “src_country=”Reserved”” and SyslogMessage notcontains “service=SMTP”
Tip
Customize the query to alert on other countries by replacing “United States” in the above query with your local country.
Azure alerts for real-time response to security events of interest
Take the Log Analytics query that returns data on non-local country web access and put it into an Azure Monitor alert rule as seen in Figure 7. The alert rule will run the query every 5 minutes and look back over the previous 5 minutes of data. If any data matches the query, the alert is fired.
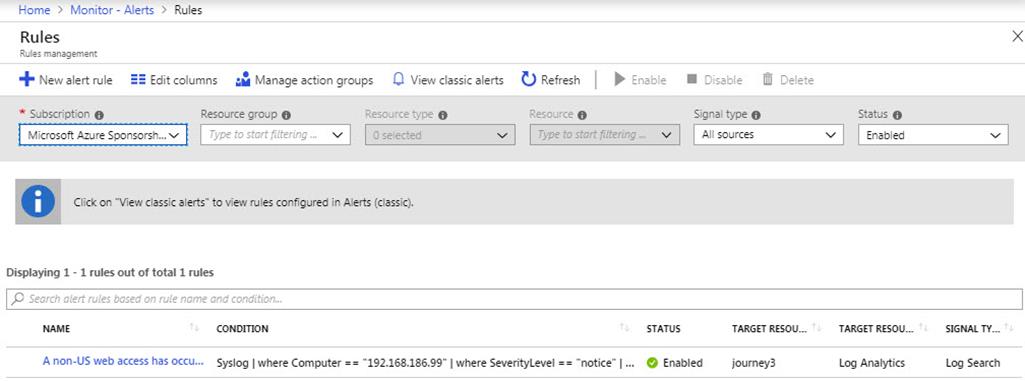
Figure 7 – Azure Monitor Alert Rule: Runs a Log Analytics query every 5 minutes and alerts on any detections in the previous 5 minutes.
The concept is that undesired counties are added to the firewall block list granularly until most or all undesired geo-traffic ceases. Azure alerts will let you know when the undesired access occurs in real time and the undesired country can be added to the firewall block list immediately if appropriate. Figure 8 is the product of an alert rule with emailed notification; it clearly lets you know which country gained access.
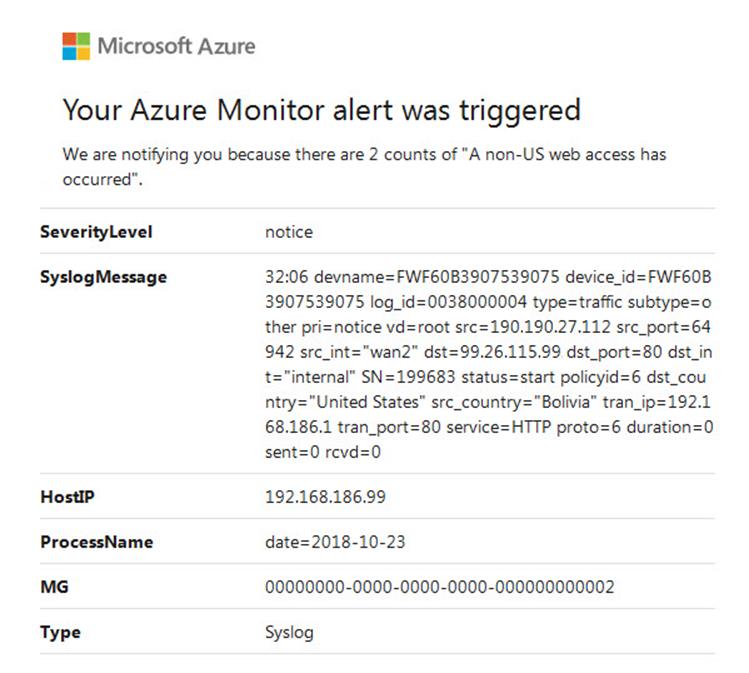
Figure 8 – An Azure Monitor Alert: Received via email when the Azure Monitor Alert Rule fires.
Measuring effectiveness of the geo-blocking firewall rules
A final demonstration of using the solution for security decision making can be seen in Figure 9, which are two more visualization parts included in the Fortigate syslog solution for Azure Log Analytics. These visualizations track the blocked vs. permitted accesses on HTTP and HTTPS protocols over time. Before starting this process, virtually all accesses were permitted. After blocking a subset of undesired global geographies (as they presented themselves via Azure Monitor alerts), HTTP traffic is reduced by 60% and HTTPS traffic by 42%.
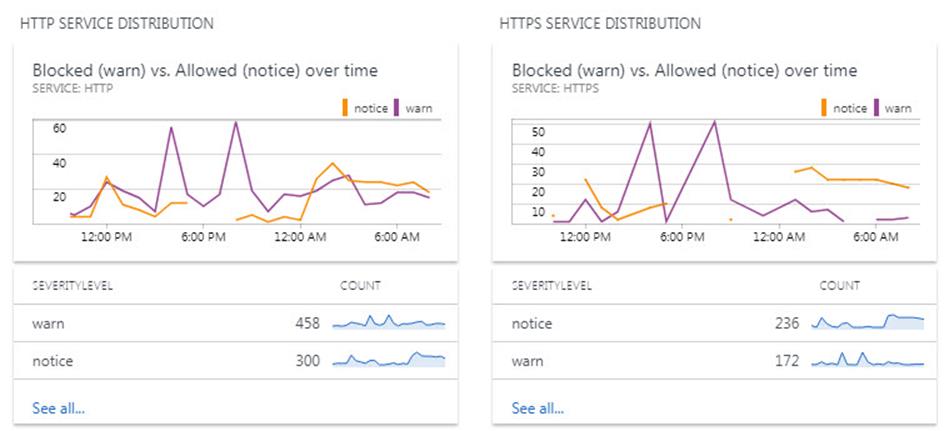
Figure 9 – Solution visualization parts: Measuring the effectiveness of firewall policies to reduce unwanted web traffic.
Tags: #MVPBuzz #Azure #AzureLogAnalytics #FortiGate #Fortinet #Firewall #NetworkSecurity #netadmin #syslog

4 thoughts on “Connect your firewall to Azure Log Analytics for security insights”
“Just as all Fortinet customers don’t have a FortiManager”.
You mean FortiAnalyzer, right? As
FortiManager is the mass-management product, not intended to log collection/analyses.
Thanks Alex, I updated the article. John
Hi John,
you wrote “for details on how to deploy and configure the Linux forwarder, see my previous article.” but I don’t see configure Linux machine.
Do you mean something like that ?
https://community.spiceworks.com/how_to/65683-configure-ubuntu-server-12-04-lts-as-a-syslog-server
https://www.tecmint.com/create-centralized-log-server-with-rsyslog-in-centos-7/
Find that article here Lukasz: https://clearpointe.cloud/2018/01/04/azure-log-analytics-best-syslog-destination/