It has been my pleasure to author an automation solution for Microsoft Sentinel that has been accepted into the official Microsoft GitHub repository. This article describes the solution and offers additional tips and information not included in the GitHub ReadMe. I also share some impressions with my first experience contributing code to Microsoft Sentinel GitHub (Figure 1).
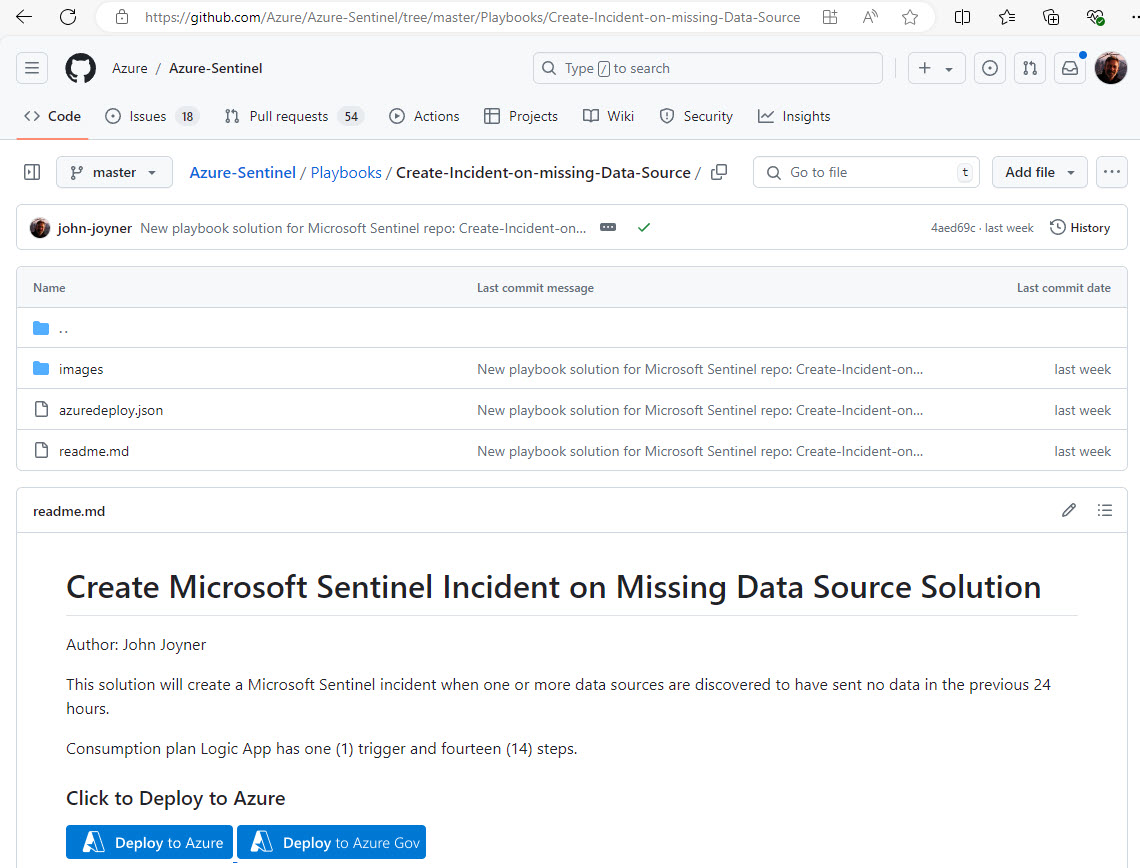
Figure 1 – The solution in the Microsoft Sentinel GitHub repo ready to deploy to your subscription(s).
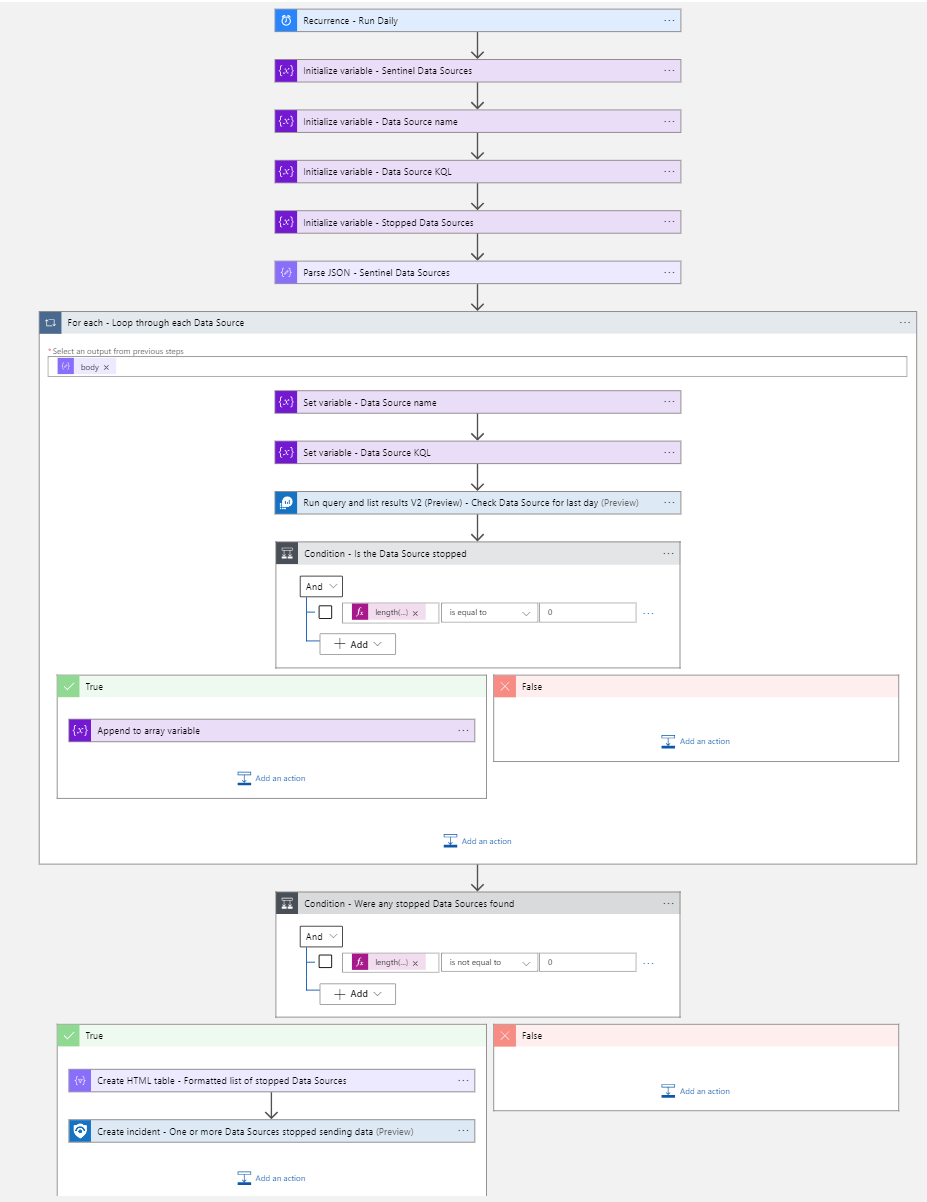
Detecting Microsoft Sentinel data source outages
The Microsoft Sentinel SIEM/XDR product, like all SIEMs, is critically dependent on the steady throughput of logs and data from security-relevant data sources. The average Microsoft Sentinel workspace may have as many as 20 or more data source categories, such as streaming logs from servers and firewalls as well as service-based alerts from Microsoft services such as Entra ID and M365 Defender or third-party services such as Okta and CrowdStrike. With the advent of the Azure Monitor Agent (AMA), delivery of logs from devices and Windows and Linux servers into Microsoft Sentinel now also depends on Data Collection Rules (DCRs) working properly.
Reducing the risk of the ‘nightmare scenario’
All these disparate data sources stream into one location, the Azure Log Analytics workspace where Microsoft Sentinel is installed. Without some means to detect when one or more data sources stops sending data, it’s a given than one day a data source will quiesce and no one will notice, perhaps until it’s too late. The nightmare scenario is: That the key to detecting a serious penetration in progress, such as a ransomware event, goes unnoticed by the SIEM–because the specific data source containing the indicator of compromise had ceased sending data before the critical event and no one noticed.
There are existing solutions to detect missing data sources and other ways to alert security teams. There is a built-in Microsoft Sentinel feature called Sentinel Health which can be enabled in the Microsoft Sentinel -> Settings menu which monitors a very limited set of data connectors. This is a nice feature but it’s less useful in the present release due to the limited scope of coverage.
You can also create one or more Microsoft Sentinel Analytics scheduled query rules which perform essentially the same function as the Logic App, which is, to run KQL and check for missing data sources. This is a fine approach but requires managing the missing data source logic in parallel with the security detection ruleset. Using a single Logic App avoids query rule sprawl and reduces the opportunity for error by consolidating all missing data source logic in the Logic App.
Installing and using the “Create-incident-on-missing-Data-Source” playbook
If you are a Microsoft Sentinel customer, consider deploying the playbook to your environment. Follow these steps to do so:
- Browse to the solution ReadMe page in the Azure GitHub repository at this URL: https://github.com/Azure/Azure-Sentinel/tree/master/Playbooks/Create-Incident-on-missing-Data-Source.
- Click on the Deploy to Azure button (or the Deploy to Azure Gov button). (see Figure 1 above).
- Select the Resource Group to create the playbook in and type in the name of the Resource Group and Log Analytics workspace where Microsoft Sentinel is installed (See Figure 2).
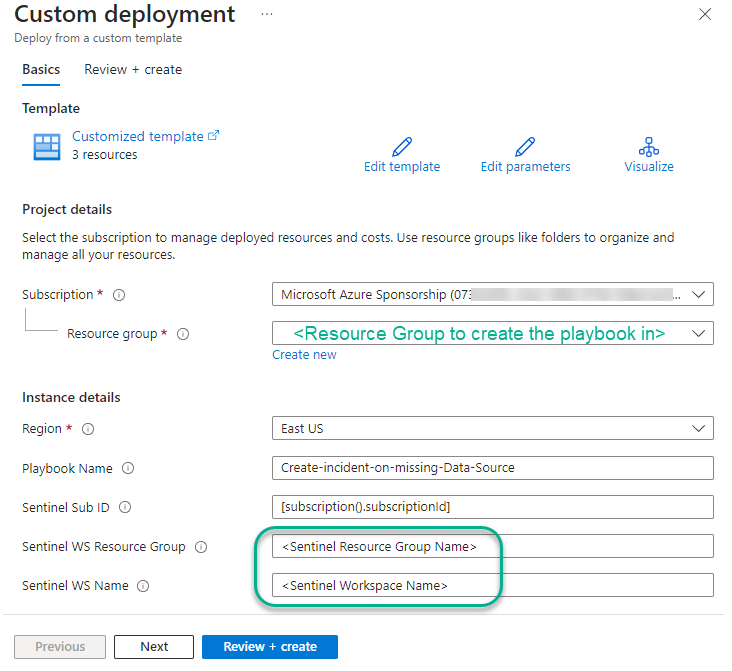
Figure 2 – After pushing the Deploy to Azure button, select the resource group for the playbook and type the information about your Microsoft Sentinel workspace.
4. Push the Review + Create button.
5. Authorize the two (2) API connections as detailed in the GitHub ReadMe page. (Not duplicated in this article).
6. Customize the “Initialize variable – Sentinel Data Sources” task in the Logic App as described in the GitHub ReadMe page. Here are some tips on how to select the data sources to customize the Logic App task with and how to locate the KQL needed to match for the selected data sources.
- Consult the data sources found at Microsoft Sentinel -> Configuration -> Data connectors as seen in Figure 3. The Data types list for the selected connector exposes the name of the Log Analytics table to use for the KQL portion of the data source entry in the “Initialize variable – Sentinel Data Sources” task in the Logic App.
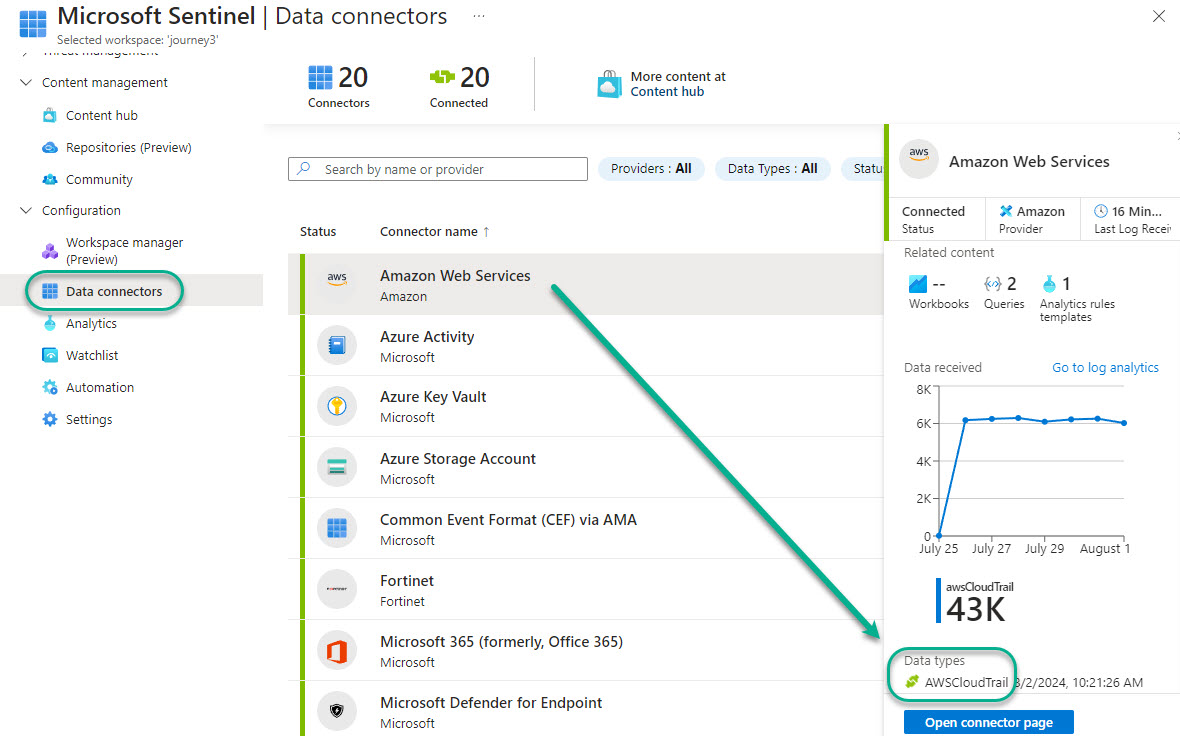
Figure 3 – Finding the Sentinel Data type (table name) to query for in the Logic App’s ‘Sentinel Data Sources’ variable.
- Browse the Tables list or use the KQL search shown in Figure 4 to locate the KQL table names to use in the “Initialize variable – Sentinel Data Sources” task in the Logic App. Remember that some data types require a filter to be meaningful, such as the AzureDiagnostics table which requires “| where” filters in the KQL to specify the Azure service type the diagnostic logs belong to (such as Network Security Groups or Automation Accounts, etc.).
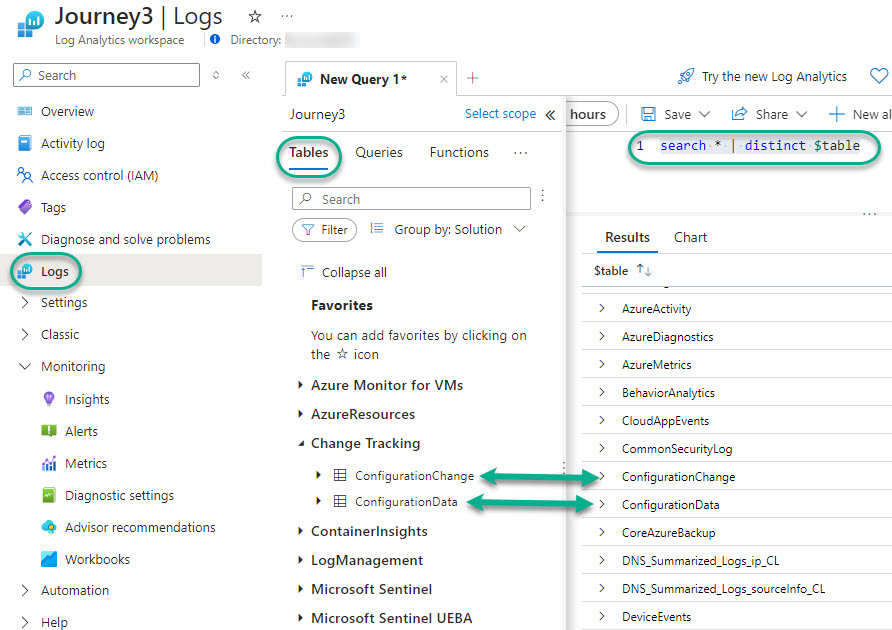
Figure 4 – Identifying other table names you might use to populate the Logic App’s ‘Sentinel Data Sources’ variable.
- Inspect the Data sources being collected by Azure Monitor Data Collection Rules (DCRs) to identity candidates to use in the “Initialize variable – Sentinel Data Sources” task in the Logic App (See Figure 5). Particularly look for important data sources not included in Microsoft Sentinel data connectors, such as VMInsights, IIS logs, and Change Tracking.
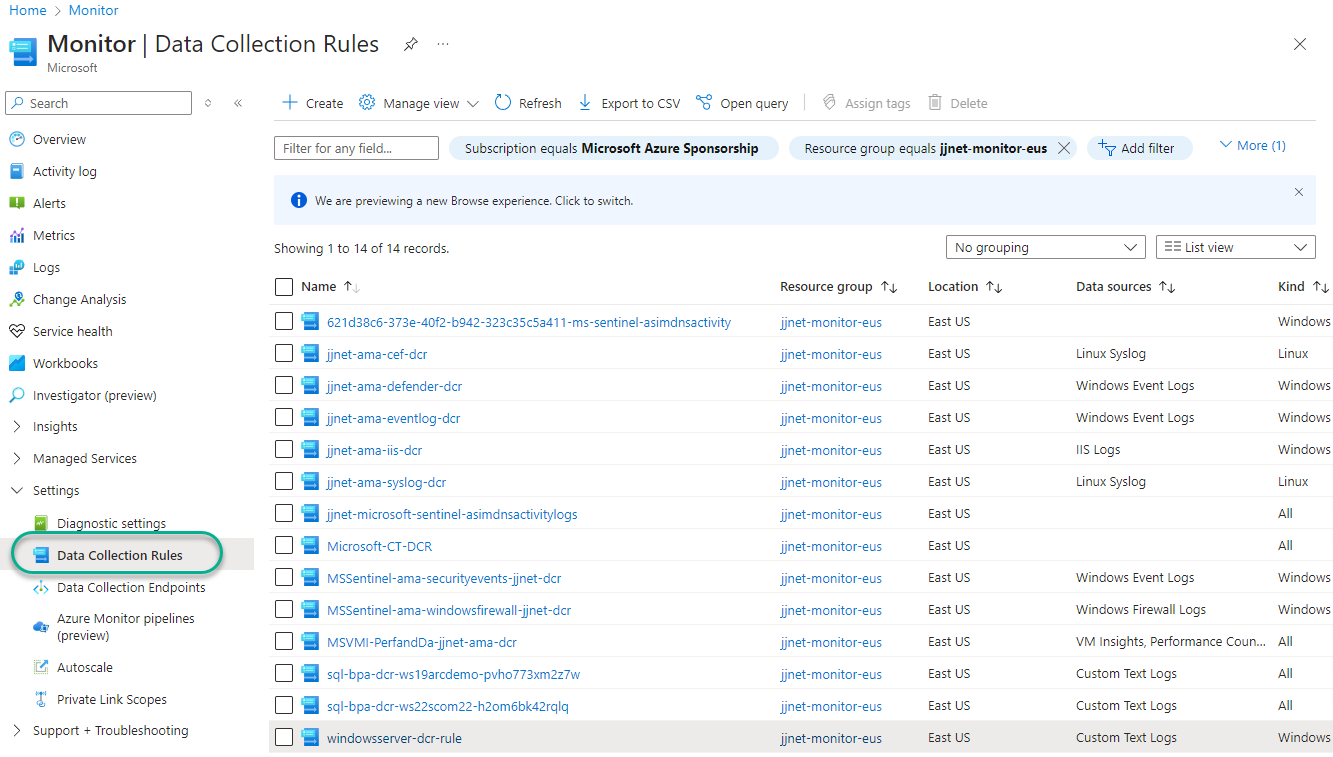
Figure 5 – Browsing the data sources collected by Azure Monitor Data Collection rules.
Other modes to employ the playbook code
This solution is packaged as a Microsoft Sentinel playbook that generates Microsoft Sentinel incidents with user-based API connections when missing data sources are found, but the underlying Logic App code can be modified to work in several other modalities. This section covers replacing the user-based API connectors, replacing the Microsoft Sentinel incident creation with an email notification, and reusing the code in a Microsoft Monitor only scenario.
Replace the user identity-based API connectors with service principal or managed identity connectors
The Logic App Create-incident-on-missing-Data-Source initially deploys configured for user-based credentials to perform the Azure Log Analytics and the Microsoft Sentinel tasks. The Azure user that pushes the Authorize button for the connectors after installing the Logic App is the user context under which the automation will run. This is suitable for testing and evaluation, but when you proceed with a production deployment, you can modify the Logic App as described next.
Either create the service principal or enable the system-assigned or user-assigned managed identity
The user-based credential can be replaced by a service principal or one of two types of managed identity. Follow these procedures:
- Enable service principal for Logic App Task permissions: https://learn.microsoft.com/en-us/entra/identity-platform/howto-create-service-principal-portal (least common method)
- Authenticate Azure Monitor logs connector in Logic App with system-assigned managed identity: https://azure.microsoft.com/en-us/updates/authenticate-azure-monitor-logs-connector/ (most common method) (See Figure 6 below)
- Authenticate Azure Monitor logs connector in Logic App with user-assigned managed identity: https://learn.microsoft.com/en-us/azure/logic-apps/authenticate-with-managed-identity?tabs=consumption#create-user-assigned-identity-in-the-azure-portal (A convenient and modern method)
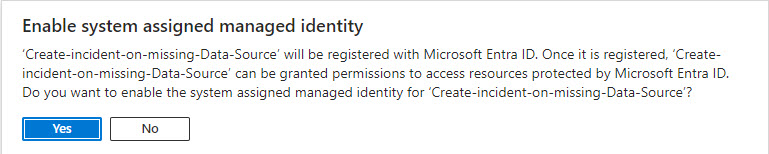
Figure 6 – Confirmation dialog when you enable the system assigned managed identity of the Logic App.
Assign the service principal or managed identity permissions to Azure resources
Use the Logic App -> Settings -> Identity control to enable a system-assigned identity for–or add a user-assigned managed identity to–the Logic App. Only one type (system-assigned or user-assigned) can exist for each Logic App.
- Role-based access for Service principals and user-assigned managed identities must be configured via the Access control (IAM) menu of each management group, subscription, or resource group permission is granted to, or by other means such as scripting.
- Role-based access for system-assigned managed identities can be configured in the Azure portal within the context of the Logic App which is very helpful. Push the Add role assignment button on the System-assigned Identity menu page, select the scope and role and push the Save button.
- The Azure RBAC roles of Log Analytics Reader and Microsoft Sentinel Contributor permissions are required for the respective Logic App tasks. Permission can be granted at the management group, subscription, or resource group level. Figure 7 is an example of the permissions given to a system-assigned managed identity:
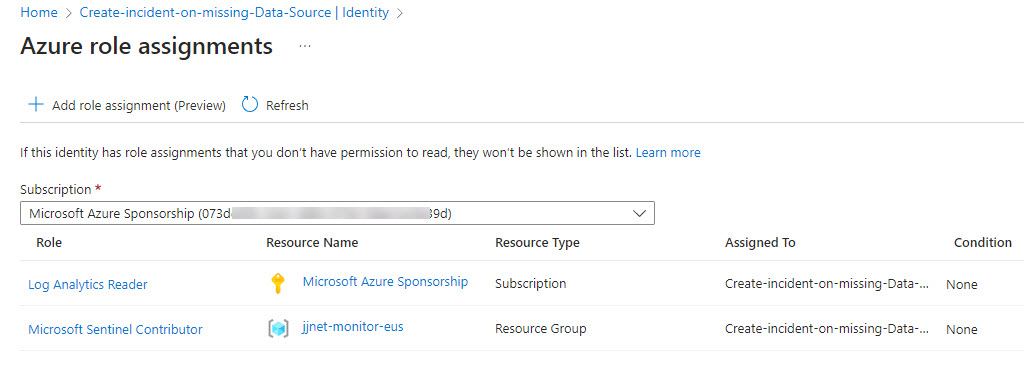
Figure 7 – View of the Logic App’s system assigned managed identity permissions after assigning necessary roles.
- The resource group specified for Microsoft Sentinel Contributor must be one of the resource groups that contain the playbooks you gave Microsoft Sentinel permissions to run in the Microsoft Sentinel console at Settings -> Playbook permissions.
Replace user-based API connectors with service principal or managed identity connectors
After the service principal(s) or managed identity is created and permissions assigned, the actual tasks inside the Logic App must be edited to use the new identity.
- Edit the Logic App and locate the Run query and list results (V2) – Check Data Source for last day task.
- Click the Change connection link at the bottom of the task.
- Click the Add new button, then select Logic Apps Managed Identity as seen in Figure 8.
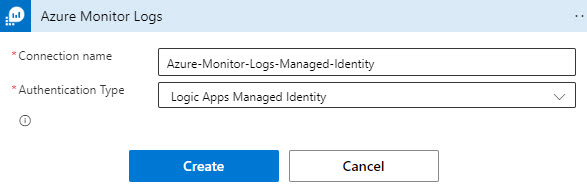
Figure 8 – Specifying the Logic Apps Managed Identity authentication type for the Azure Monitor Logs task.
4. Type a Connection name that is meaningful to you and push Create.
5. Edit the Logic App and locate the Create incident – One or more Data Sources stopped sending data task.
6. Click the Change connection link at the bottom of the task.
7. Click the Add new button, then select System-assigned managed identity as seen in Figure 9.
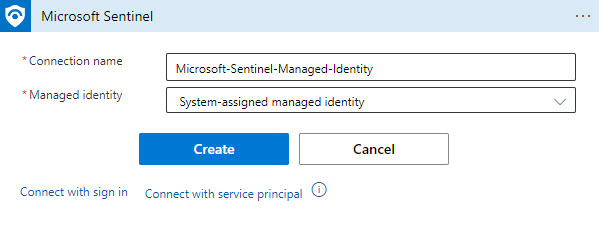
Figure 9 – Specifying the System-assigned managed identity authentication type for the Microsoft Sentinel task.
8. Type a Connection name that is meaningful to you and push Create.
9. Save the Logic App and push the Run Trigger button to test.
Using a Service Principal instead of a Managed Identity
Both Logic App task types (Log Analytics and Microsoft Sentinel) support Service Principals in lieu of managed identities. To use a service principal for an API connection, select Connect with Service Principal in the above step(s). You will need the Tenant ID of the Entra ID application, the Client (or Application) ID of the Microsoft Entra ID application, and the client secret of the Microsoft Entra ID application.
Delete retired user-based API connectors
After you have verified the Logic App is working using the desired authentication method, delete the user-based API connectors created by default when the Logic App was first deployed for testing and evaluation. These API connectors were assigned distinctive names to make them easy to locate and delete when no longer needed.
- Navigate to the Subscription -> Resources menu, locate, and delete the two API connections as seen in Figure 10.
- By default, the names of the connectors are azuremon-Create-incident-on-missing-Data-Source and azuresentinel-Create-incident-on-missing-Data-Source.
- For each one, push the Delete button.
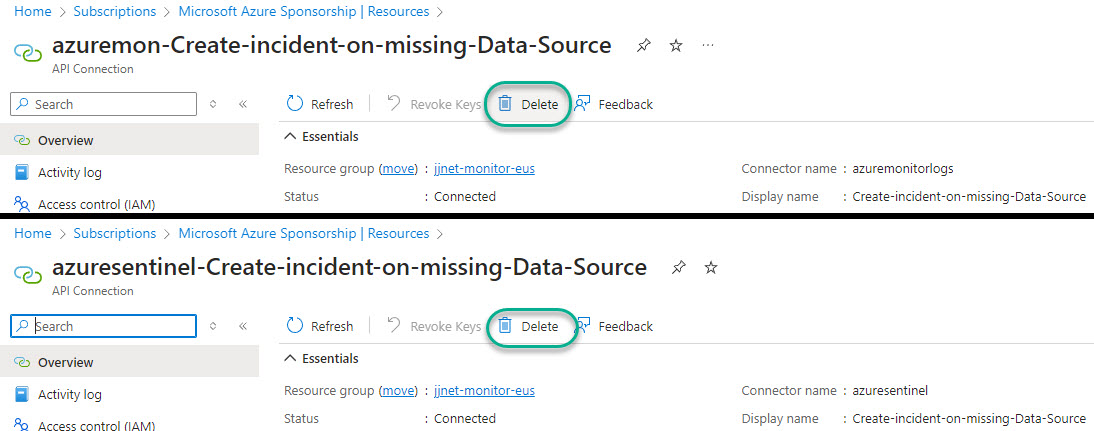
Figure 10 – Deleting the user-based API connectors after migrating to different authentication method(s).
Email alert rather than create Microsoft Sentinel incident
The last step in the Logic App is to create a Microsoft Sentinel incident if any stopped data sources are discovered. That last Logic App task, Microsoft Sentinel -> Create Incident, can be replaced with the Office 365 Outlook -> Send an email task. The effect will be to bypass the Microsoft Sentinel console when stopped data sources are found, and alert email recipients instead. Here are the steps to replace Microsoft Sentinel incidents with Office 365 emails:
- Locate the Create incident – One or more Data Sources stopped sending data task at the lowest level of the Logic App.
- Push the add an action button under the task and select the Office 365 Outlook -> Send an email task.
- Copy the title of the Microsoft Sentinel incident to the subject of the email.
- Copy the description of the Microsoft Sentinel incident and paste it into the Body of the email.
- Delete the Create incident – One or more Data Sources stopped sending data task.
- Save the Logic App and test (Run Trigger).
Your email recipients should receive something like what’s seen in Figure 11 if there are stopped data sources.
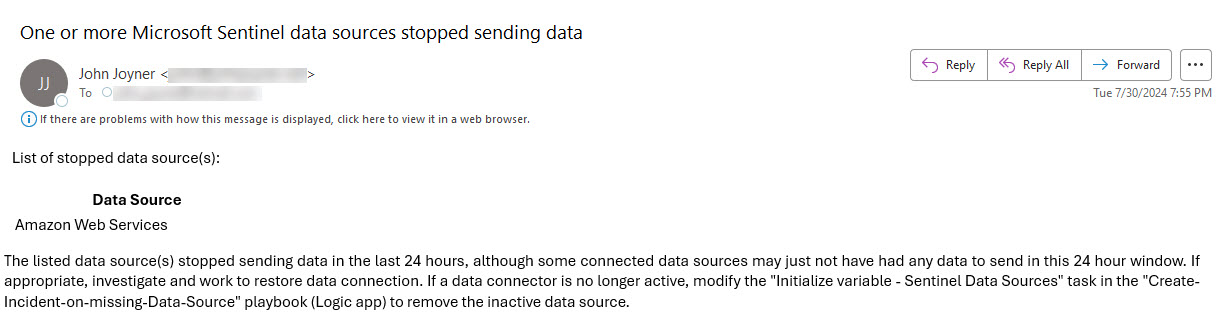
Figure 11 – Example email alerting product as replacement for the Microsoft Sentinel incident product.
Use for Azure Monitor applications with email alert
While this solution focuses on Microsoft Sentinel data sources, once the Logic App is converted to sending alerts by email as described in the preceding section, such a Logic App is perfectly suited to serve the same function in a monitoring-native solution not associated with Microsoft Sentinel. To migrate the Logic App for this scenario:
- From the Overview page of the Create-incident-on-missing-Data-Source Logic App, push the Clone button.
- Enter a new Logic app name such as “Send-email-on-missing-Azure-Monitor-Data-Source” and push Create.
- Edit the Send an email task in the cloned Logic App to change the subject from “…Microsoft Sentinel…” to “…Azure Monitor…” and replace the name of the playbook referenced in the Body of the email to the name of the cloned workbook.
- Edit the list of data sources in the Initialize variable – Sentinel Data Sources task at the head of the Logic App to match the expected diagnostic log and DCR-based data source types in the Azure Monitor environment.
- Save the Logic App.
Impressions on contributing Microsoft Sentinel code via GitHub
I have had a personal GitHub account for years and have used it occasionally to share code such as Azure Policy and Azure Automation artifacts. The point in using my GitHub repo for some items was to make it easy for readers of my blog to locate and download scripts and code I authored which I may have referenced in articles.
However, in the case of this “Create-incident-on-missing-Data-Source” automation solution, which is an Azure Logic App, the GitHub-assisted “Deploy to Azure” button was necessary since Logic App code can’t simply be cloned or ‘cut-and-pasted’ from a source file. Exported Logic App code needs a lot of ‘ARM template normalization’ to work in other environments and this is achieved by packaging Logic Apps in GitHub in a standardized fashion.
My first step was to deploy the playbook to my personal GitHub account for development and testing. Once the newly minted Logic App was proven to be deployable to multiple Entra ID tenants and Azure subscriptions, a final (and optional) step is to submit the code to Microsoft for inclusion in the global GitHub account for the Microsoft Sentinel product.
Getting a Logic App ready for GitHub
I found this video from Microsoft Security Technical Specialist Nathan Swift extremely helpful, I watched it several times to get familiar with multiple new tasks. To get started, locate a pre-existing Logic App in the Microsoft Sentinel Playbook repository that is like your solution to use as a guide.
There are a minimum of two (2) files associated with each GitHub code submission: the ReadMe.MD file which is an HTML markdown file describing how to deploy the Logic App, and the AzureDeploy.JSON file which is the carefully crafted ARM template that deploys the solution to anyone’s Azure subscription. In his video, Nathan walks you through opening these two files in side-by-side Visual Studio Code instances, one with the (reference) solution already published in Azure Github, and the other with your new code (see Figure 12).
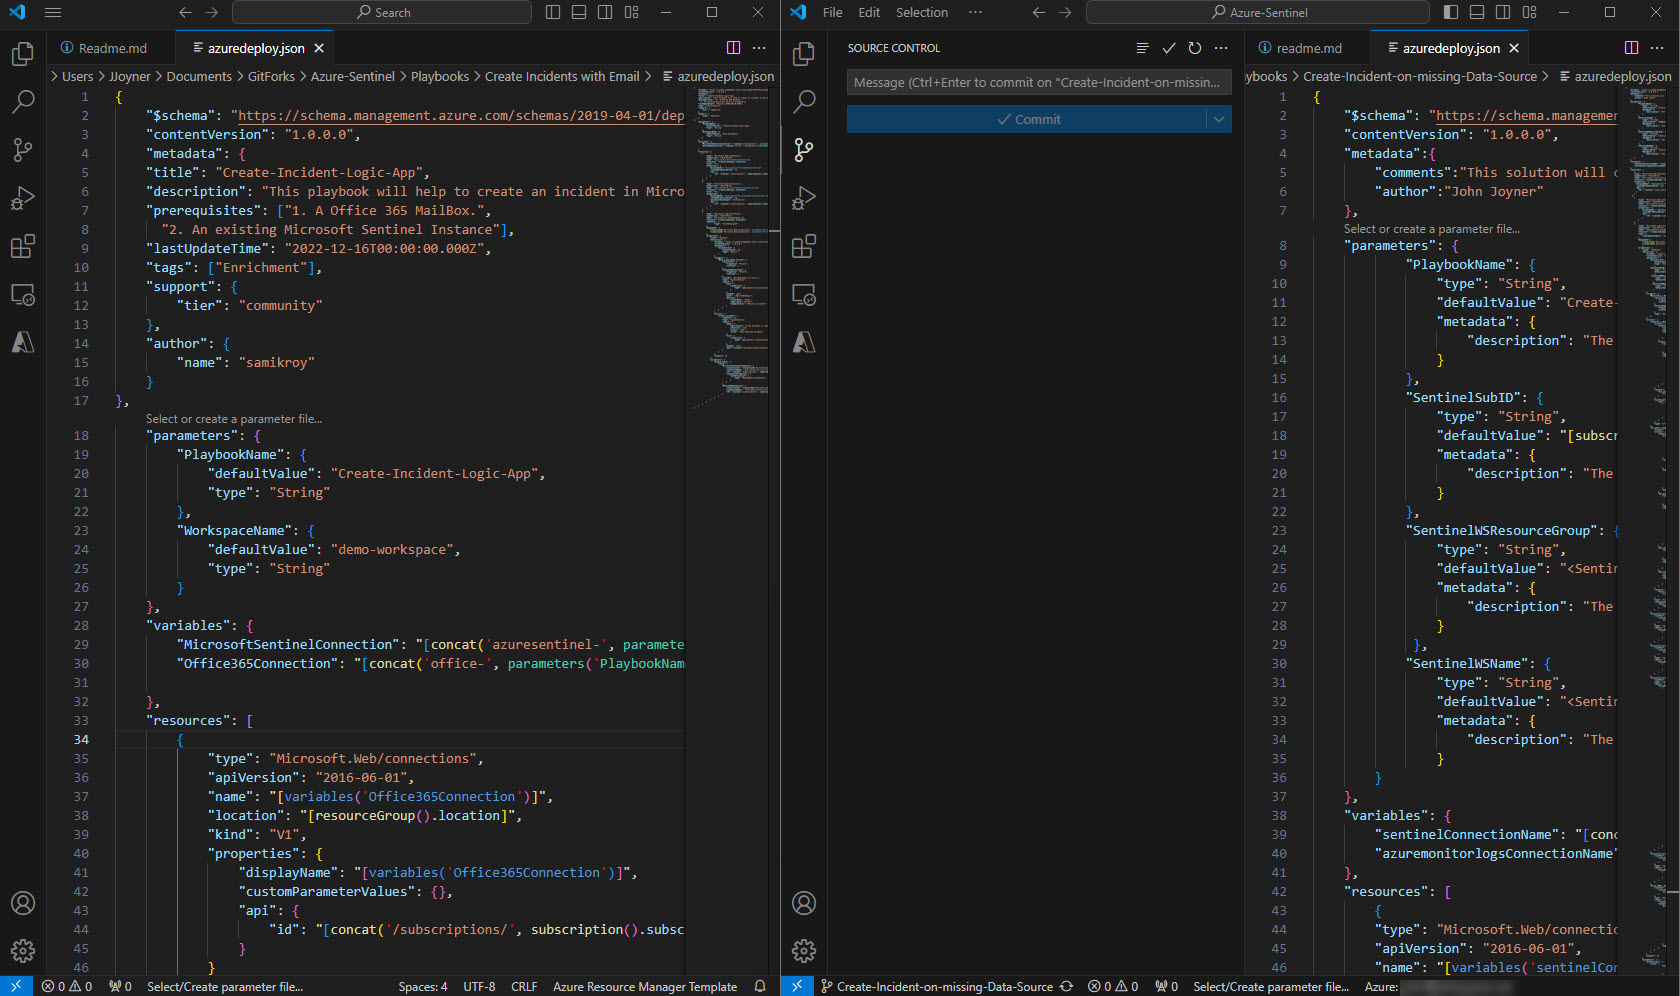
Figure 12 – A Microsoft Sentinel playbook development environment using two (2) instances of Visual Studio Code. On the left is a similar, reference solution already in the Microsoft repository and on the right is the new code to be submitted to Microsoft for review. This screenshot captures the moment after changes to the local branch of the forked repository are committed.
Creating your ReadMe.MD
The HTML markdown language in the “source” (or reference) ReadMe.MD file is not difficult to copy and paste into your (new) “target” ReadMe.MD file, of course with significant customization for your solution which will be different from the source solution. You will find the ‘magic’ URL format and the graphic file URL for the “Deploy to Azure” button in the source ReadMe.MD file. You can include diagrams inside your ReadMe.MD by creating an “images” folder containing graphic files and linking to them in the HTML markdown document.
For my testing, I first deployed the solution to my personal GitHub account, so I changed the URL behind the “Deploy to Azure” button to point to my own GitHub account rather than the Microsoft Sentinel GitHub account. The version of the ReadMe.MD file submitted to Microsoft for review must point to the Microsoft Sentinel GitHub account.
Creating your AzureDeploy.JSON file
You start with an export of your playbook from the Azure portal using the Logic App -> Automation -> Export template -> Download feature. You then begin a clean-up of the exported template to strip it of information specific to your tenant/subscription. Use the “source” (or reference) AzureDeploy.JSON from a playbook already shared in the Microsoft Sentinel repository as your guide to how to modify your exported template. You will modify the “parameters” and “variables” sections, and replace renamed variables in the “resources” section, among other changes.
A valid test of your ‘normalized’ AzureDeploy.JSON file is to deploy the solution as a template using the Azure Portal -> Create a resource -> Template deployment (deploy using custom templates) -> Create -> Build you own template in the editor -> Load file feature. If your AzureDeploy.JSON file succeeds as an Azure template deployment, it will work the same invoked from your ReadMe.MD using the “Deploy to Azure” button experience.
Submitting code to Microsoft GitHub
Once your ReadMe.MD and AzureDeploy.JSON file (as well as any diagrams/images) are working from your personal GitHub account, you can proceed to submit your code to Microsoft for review, and if accepted, posting alongside the many fine playbook solutions available to users worldwide. Microsoft provides invaluable guidance on how to get started contributing at this URL: https://github.com/Azure/Azure-Sentinel/blob/master/GettingStarted.md. The method I used requires Visual Studio Code and the “Git” executable.
Here are the high-level steps to submit your playbook to Microsoft for review:
- Log into your personal GitHub account.
- Fork the master branch of the “Azure-Sentinel” repository to your own GitHub account.
- Clone the fork to your local computer (download “Git” from https://git-scm.com/downloads).
- Create a “branch” for the particular project you are uploading (because we don’t work directly with the “master” branch).
- Open the branch in Visual Studio Code (confirm you are working with the named branch for your project and not the “master” branch).
- Create a new folder in the locally created branch on your computer.
- Populate the folder with your ReadMe.MD and AzureDeploy.JSON files. Create an images subfolder and copy any diagrams to there.
- Stage your changes by pushing the “+” button then Commit the changes.
- Publish the new files to the branch of forked repository in your GitHub account.
- Submit a Pull Request (PR) from your forked repository.
- Fill in the comments section to include details on what the pull request is doing (this comment is read by the Microsoft reviewer that will be assigned to your PR).
- Create the PR and you can then navigate to the Microsoft Sentinel official repository where you will see your PR in a Review Required status (see Figure 13)
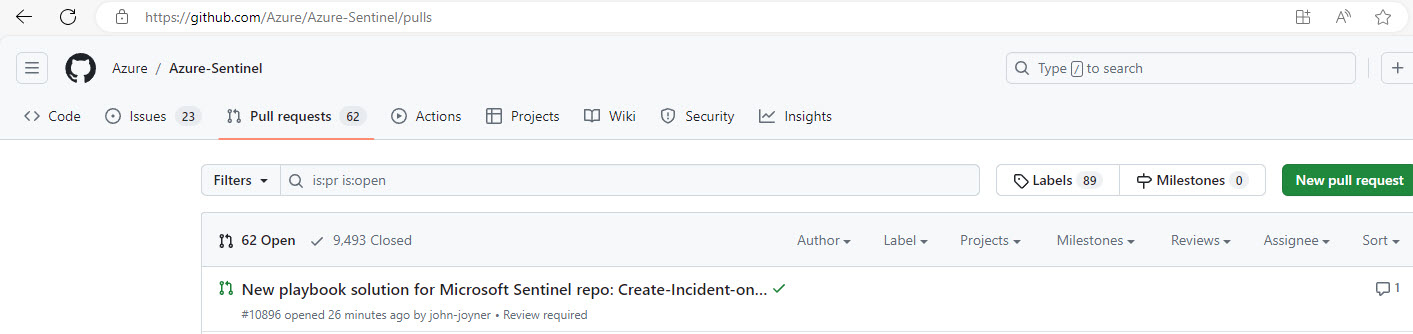
Figure 13 – The first public evidence of your contribution appears as a new pull request (PR) in the Microsoft Sentinel GitHub repository.
The Microsoft code reviewer(s) assigned to your PR will correspond with you as needed to complete the review, which can take several days. Once approved, your PR will be merged with the Microsoft repository and will see your code in the main repository. Once everything looks right, you can delete the temporary branch you created (the “Clean-up” section of the reference explains how).
I hope the community finds this contribution useful. Issues with the solution can be posted to the Microsoft Sentinel GitHub repository (Issues -> New Issue) or better, as comments to this blog article (Leave a Reply).
#MVPBuzz #MicrosoftSentinel #SIEM #AzureMonitor #CloudSecurity #LogicApp