
Azure and SCOM solutions detailed and compared
Situation: You have an Azure VM running Windows Server hosting a high-value website. You need to do two things: (1) monitor that the website is running, and (2) if the site is discovered to be stopped, you want to send a start command to the website.
Tools available: Since the VM is running in Azure, you have all the Azure Monitor and Azure Automation features available to do the job. The VM is also managed by System Center Operations Manager (SCOM).
Problem: Neither Azure nor SCOM have native solutions to do exactly this ask. You will need to author some custom artifacts in either Azure or SCOM to discover which method is right for your environment.
This white paper contains detailed instructions to deploy both Azure-based and SCOM-based solutions. At the end of the article there is a summary / pros & cons section.
What SCOM and Azure bring to the table
-
SCOM has a website monitor built-in, and there is a ‘Start IIS Web Site’ console task shown in Figure 1. This built-in task comes with the IIS management packs and works great when manually launched from the SCOM console after a website is discovered stopped. However the task (which leverages the Windows appcmd.exe utility), cannot be specified as an automatic recovery action.
-
Azure can provide website monitoring via an Azure Application Insights availability test, but any automatic remediation will need to be authored. Specifically, Azure Monitor can respond to Application Insights ‘website down’ alerts by launching an Azure Automation runbook that starts the website.
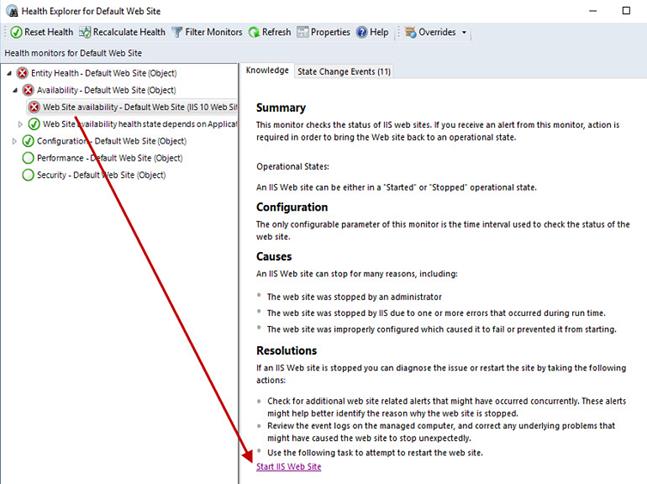
Figure 1 – SCOM’s built-in console task to start a stopped website.
Solution using SCOM
Managing a website with SCOM is simple, just discover your Internet Information Service (IIS) computers and make them Agent-managed computers. Then import the IIS management packs from Microsoft shown in Figure 2. That’s it and you will get a SCOM alert within a few minutes if a website is found to be down.
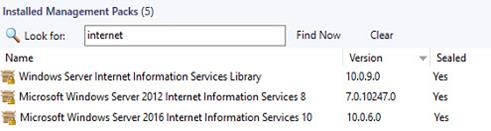
Figure 2 – Internet Information Services (IIS) management packs to import to SCOM.
As mentioned previously in this article, the built-in SCOM task “Start IIS Web Site” seen in Figure 1 can’t be automatically invoked when the monitor detects the website is down. After getting an alert about a stopped web site, you need access to the SCOM instance to launch the task manually, or just remote into the web server and start the website.
How to author the custom SCOM recovery task
To launch a recovery task automatically, you will need to author a custom recovery task as shown in Figure 3. (For this article we are focusing on Windows Server 2012 R2 (IIS 8) and Windows Server 2016 (IIS 10.)
- In the SCOM console, Authoring pane, locate the Web Site availability monitor for IIS 8 and/or IIS 10 and select properties.
- On the General tab, assign a name you will see in the console for Recovery name (such as ‘Start-Website’) and make sure “Run recovery automatically” is selected.
- On the Diagnostic and Recovery tab, push Add.
-
Enter this command line in the ‘Full path to file’ and ‘Parameters’ boxes:
C:\Windows\System32\WindowsPowerShell\v1.0\powershell.exe
-Command “&{Start-WebSite -Name ‘$Target/Property[Type=”System!System.Entity”]/DisplayName$’}”
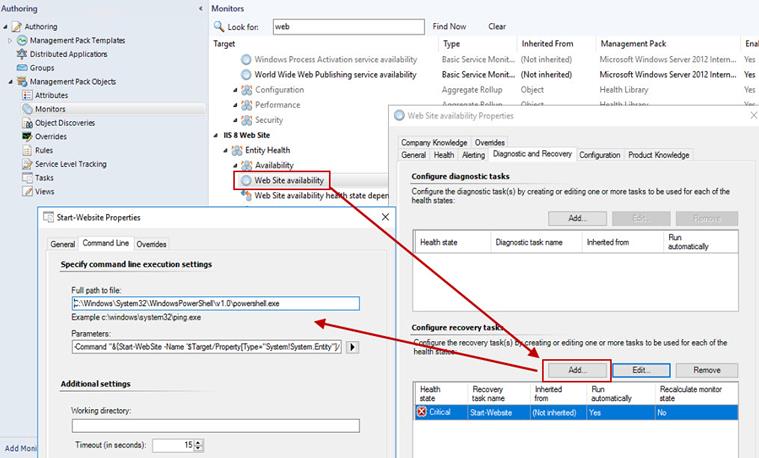
Figure 3 – Authoring a custom recovery task that will automatically start a stopped website.
Using the custom SCOM recovery task
After adding your custom recovery task(s), the task name you specified on the general tab will appear as an Additional Recovery Option as seen in the lower portion of Figure 4, which is the State Change Events tab of the Web Site availability monitor. In the upper portion of Figure 4 the successful run of an automation recovery action can be seen.
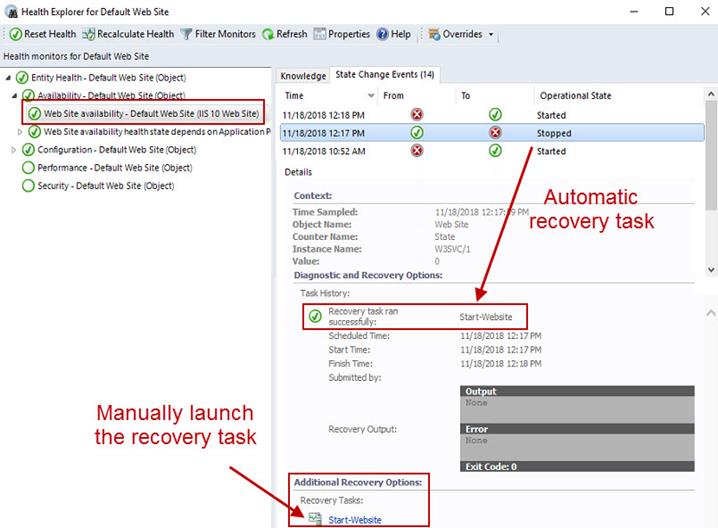
Figure 4 – A custom recovery task executed automatically and/or manually.
To turn off automatic restart of stopped web sites, edit the General tab of the Web Site availability monitor and de-select “Run recovery automatically”.
Download Start-Website recovery task management packs
To give you a head start with adding this custom recovery task, I have posted two unsealed management packs (MPs) at github: https://github.com/john-joyner/SCOM-Management-Packs-Utilities
-
Add.Task.IIS.Eight.Startwebsite.xml
-
Add.Task.IIS.Ten.Startwebsite.xml
After importing these MPs to your SCOM management group, you will find the additional recovery task “Start-Website” populated, and stopped web sites will be automatically started. The task takes input from SCOM with the name of the web site, so the automatic recovery will fire for the “Default Web Site” and any other named IIS 8 and IIS 10 web site(s) on your IIS server(s).
Solution Diagram using SCOM
Figure 5 represents a possible architecture if you have on-premises SCOM and an Azure VM running Internet Information Services (IIS).
- You could use an Azure Site to Site VPN or an Azure Express Route connection to monitor a SCOM agent on the Azure VM.
- Or you could publish an on-premises SCOM gateway to the Internet and have the Azure web server SCOM agent reach out to the gateway.
- The example solution here leverages the ability of a SCOM gateway to be connected by an inbound path from a SCOM management server (Use the ManagementServerInitiatesConnection=true
switch when running the Microsoft.EnterpriseManagement.gatewayApprovalTool.exe to reverse the normal direction of gateway to management server connection.)
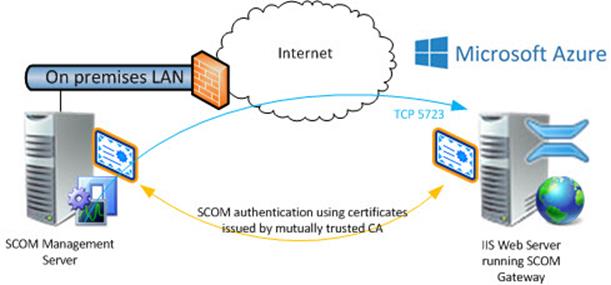
Figure 5 – A possible architecture for monitoring an IIS website on an Azure IaaS VM with on-premises SCOM.
Solution using Azure
Managing a website with tools from Azure is very possible, and this direction is the leading design in a cloud-first strategy.
Figure 6 illustrates the workflow of the various Azure components in the solution.
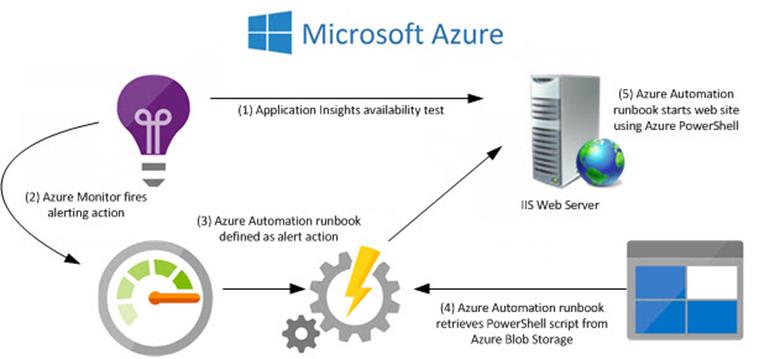
Figure 6 – How Azure components can work to deliver a website monitoring and management solution.
This method uses a PowerShell script in Azure Storage to start the website. The script is retrieved by an Azure Runbook as an alerting response to an Azure Application Insights availability test. The script is named Start-DefaultWebsite.ps1 and here is the content:
# Start-DefaultWebsite.ps1
import-module WebAdministration
Start-WebSite -Name ‘Default Web Site’
-
The script is run in Azure and requires an Azure credential (a RunAs account) with permission to interact with the Azure virtual machine (VM) hosting the monitored website.
-
To use this solution with a website not named Default Web Site, replace all instances of “DefaultWebSite” and “Default Web Site” with appropriately name(s). Use multiple monitors, alerts, and runbooks as needed for your environment.
-
The website is started by executing Start-DefaultWebsite.ps1 using an Azure custom script extension for Windows, which will be installed into the VM if not already present.
-
Custom script extensions on Azure VMs require no additional agent to install; it’s essentially an ‘out of band’ method of management for Azure VMs.
Credits: Solution uses a script developed by Vikingur Saemundsson http://saemundsson.se/?p=726
Based on the script Invoke-AzureRmVmScript.ps1 by Warren Frame https://github.com/RamblingCookieMonster/PowerShell/blob/master/Invoke-AzureRmVmScript.ps1
Step-by-Step: to deploy the Azure solution
1. Add an Application Insights Availability test for the web site as shown in Figure 7.
a. Choose the URL ping test type.
b. Select several Test locations appropriate for your business needs. The defaults for US sites are five (5) tests in the West, South Central, North Central, East, and Central US regions. You can also select from eleven (11) international sites including West and North Europe, UK, France, Asia, Japan, Brazil and Australia.
c. Later in the Define alert condition step, you can select how many test locations need to report availability failure before an alert fires.
d. Modify the Alerts configuration to select and enable Near-realtime alerts.
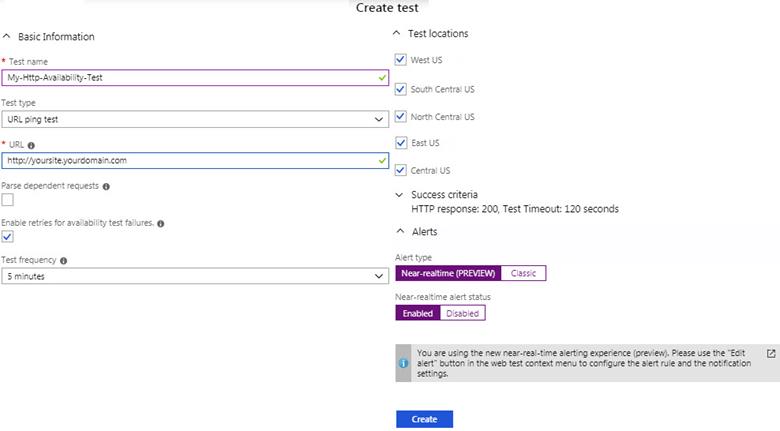
Figure 7 – Add an Application Insights Availability Test to monitor the web site.
2. Prepare the PowerShell script storage location
a. Create an Azure Storage Account.
b. In that storage account, create a Container of the Page Blob type, for example ‘scripts’ as seen in Figure 8.
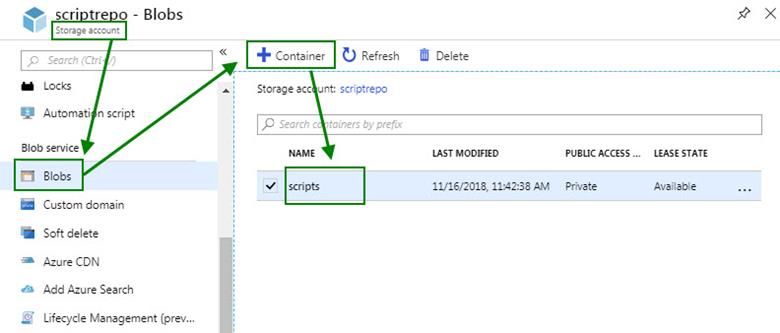
Figure 8 – Example blob storage container to host the scripts that will run in Azure.
3. Create an Azure Automation Account and select the option to create a RunAs Account as shown in Figure 9.
a. No Hybrid Runbook Workers need to be deployed (as might be necessary for an on-premises web server), because this solution runs completely in the Azure compute environment.
b. The remediation runbook will run in Azure using the RunAs account created when you created the automation account.
i. If you need a new RunAs account, create one in the Azure Portal at Automation Account -> Shared Resources -> Run as accounts -> Azure Run As Account -> Create.
ii. Accept the default name of “AzureRunAsConnection” for your hybrid runbook worker. This RunAs account will also surface in the Connections blade with the AzureServicePrincipal type.
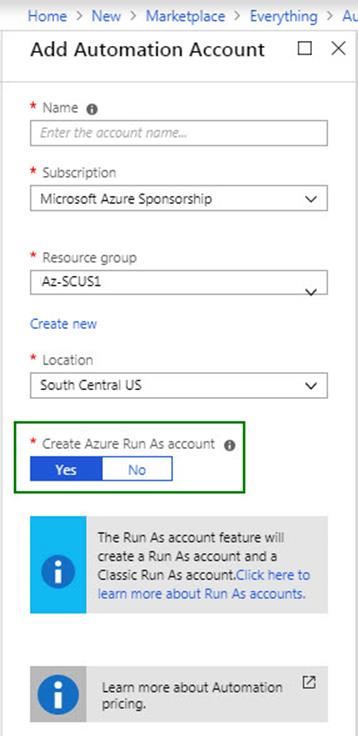
Figure 9 – Adding an Automation Account and creating an Azure Run As account.
4. Author or download the remediation script
a. To give you a head start with adding this runbook script, I have posted a suitable script at github: https://github.com/john-joyner/AzureAutomationConfigurations/blob/master/Start-DefaultWebSite.ps1
b. Follow the instructions in the script comments to replace parameters with your information.
c. Alternatively, author your own PowerShell script resource. In either case, have a script with the “.PS1” extension ready to upload into your Azure Automation runbook.
5. Add a runbook to be invoked when the Application Insights Availability test fires.
a. In your Automation Account -> Runbooks blade, press Add a runbook then select Import an existing runbook as shown in Figure 10.
b. Select the PowerShell runbook type and press Create.
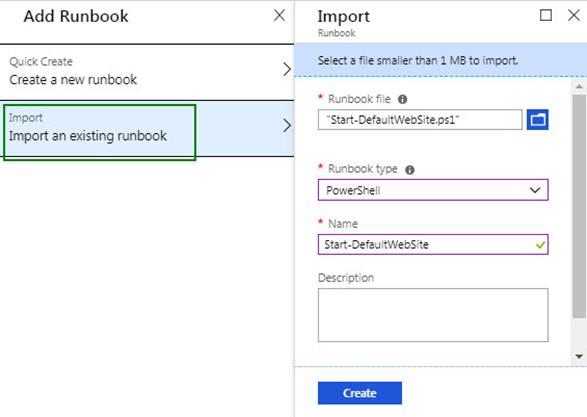
Figure 10 – Import your remediation script into an Azure Automation runbook.
6. Edit and publish the runbook
a. Locate your new runbook at Automation Account -> Runbooks, click on the runbook to open the blade for that runbook. You should see something similar to Figure 11.
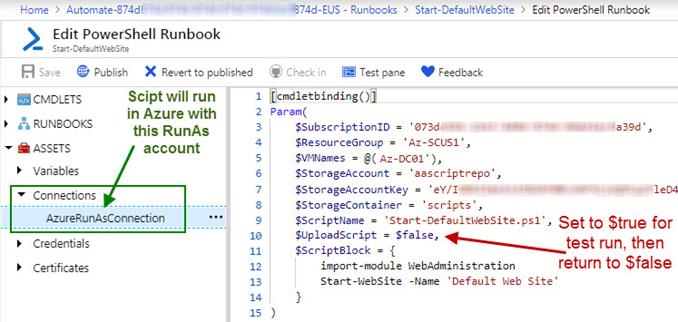
Figure 11 – Editing and testing the remediation script.
b. Change the $UploadScript value to $true and push Save, and then push Test Pane.
c. Push the Start button and wait a moment while your script runs in Azure. When complete you will see something similar to Figure 12.
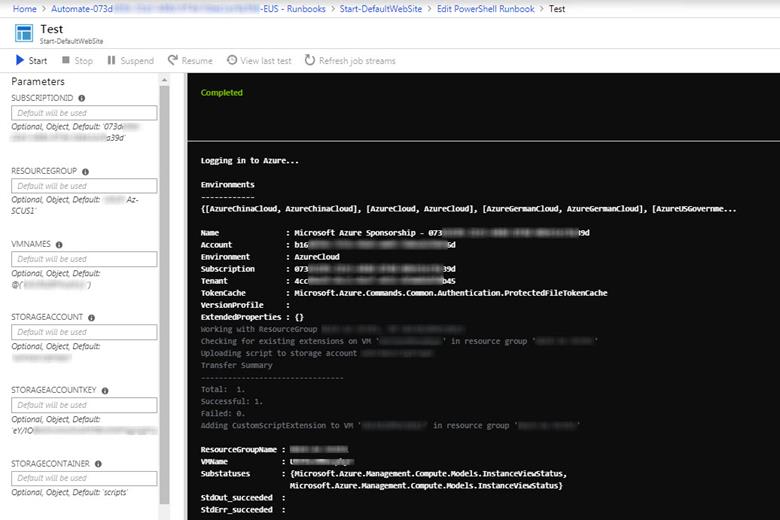
Figure 12 – Testing the recovery task runbook before Publishing. This action also copies the .PS1 script to Azure storage.
d. During the first test run, the actual .PS1 script file is created in the Azure Storage blob and container you specified (because $UploadScript = $true). You can verify by checking the contents of the page blob with Azure Storage Explorer or similar tool.
e. Press the “X” (close) button on the Test blade, select OK about unsaved edits.
f. Back in the Edit PowerShell Runbook blade, again edit $UploadScript value, now to $false, and push Save then Publish.
7. Define Azure Monitor Alert Rule Action Group
a. Navigate in the Azure Portal to Home -> Monitor-Alerts and press the Manage alert rules button.
b. Locate and click on the Application Insights Availability test created in Step 1 of this solution. The Rules management blade for your alert will open; click to expand the Define action group, then New action group as seen in Figure 13.
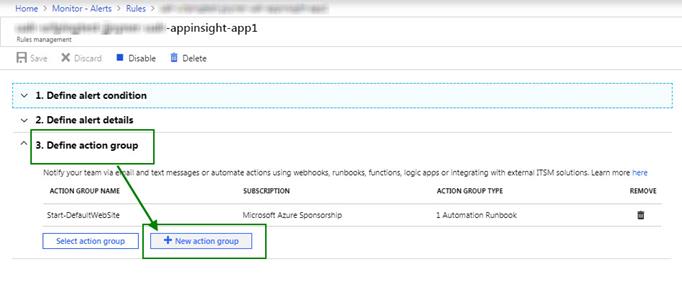
Figure 13 – Defining a new action group that automatically runs the remediation runbook.
c. In the Add action group blade, configure these settings as demonstrated in Figure 14:
i. The Action group name and Short name can be anything descriptive to your environment, but the Short name must be 12 characters or less.
ii. Set the Action type to Automation Runbook and open the Edit details link.
iii. Set the Runbook source to User, select your Azure subscription and Automation account from the drop down lists, and finally select your remediation runbook and press OK two times.
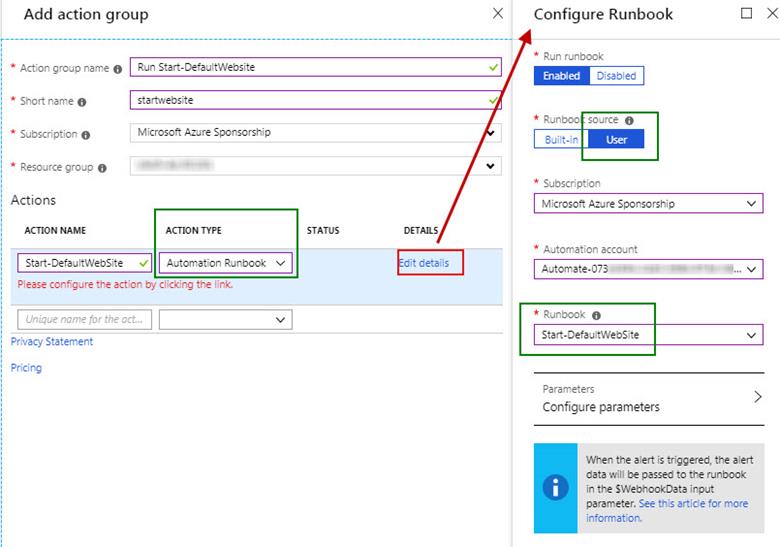
Figure 14 – Associate the PowerShell-based recovery task with the Azure Monitor alert.
d. When you return to the Rules management blade push Save.
e. The Azure Monitor Alert associated with the Application Insights Availability Test is now updated to run the remediation task automatically.
Pros & Cons of both Azure and SCOM solutions
Both solutions accomplish the simple objectives of this solution (to detect a stopped web site then automatically start it), but with very different toolsets.
- The outside-in approach of Azure is a DevOps-friendly assembly of management micro-services.
- SCOM is king in high-fidelity state-based monitoring of server internals.
Consider these comparisons:
|
Dimension |
Analysis |
|
Complexity |
Azure is simpler, SCOM requires PKI certs + heavy installs |
|
Remediation Type |
Both solutions: Run a PowerShell script (.PS1) |
|
Alert Latency |
SCOM is faster, <2 mins vs <5 mins for Azure |
|
Alert Quality |
Multiple Azure watchers have global perspective, SCOM monitor is single-threaded |
|
Alert Options |
Azure has many more options for alerting, such as sending an SMS text, opening an ITSM ticket, etc. |
|
Reporting Type |
SCOM has built-in SSRS-based reports, Azure reporting leverages custom PowerBI reports. |
The right choice for your hybrid environment might be a hybrid solution!
Additional credits: The content of this white paper represents the objective of the final exam for the cloud computing management class I teach at the University of Arkansas Little Rock IFSC-4399 02. The students have each built in-Azure and on-premises SCOM environments for the final exam. On-premises environment courtesy of UALR EIT @UALREIT. In-Azure environment courtesy of Microsoft MVP program Azure Sponsorship @MvpAward. Course is sponsored by ClearPointe Technology @ClearPointe_inc.
Tags: #MVPBuzz #Azure #AzureVM #Scripting #AzureAutomation #PowerShell #SCOM #IIS
2 thoughts on “WHITE PAPER: Automatic Remediation Tasks in the Hybrid Environment”
This site truly has all the information and facts
I needed concerning this subject and didn’t know who to ask.
Thank you for the good feedback. 🙂