App owners responsible for running web apps in Azure want to know when their business critical web apps get restarted. This article describes a method to create an Azure Monitor alert rule to achieve that objective. In the process we will explore all the alerting and logging options available for Azure web apps.
When an Azure web app is restarted on command by a user, the app restart is logged in the Activity log of the web app as seen in Figure 1.
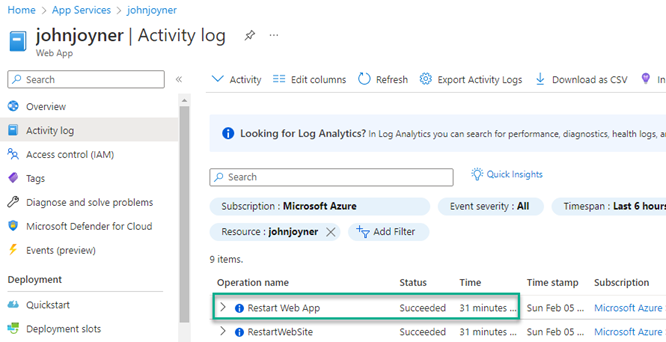
Figure 1 – Web apps restarted by users are easy to spot in the Azure Activity log, but not so for system-directed app restarts.
If you want to be alerted when a web app is restarted on command, you can create a Platform signal-based alert rule that alerts when the Restart Web App entry is found in the Activity Log.
Challenge: App restarts triggered by non-user processes, that is, system processes like scaling events and automatic restarts after app crashes, don’t always make an Activity Log entry that you could alert on with a Platform signal. Some app owners really want to know every single time their web sites are restarted, for any reason.
Native Azure Monitor features
The primary means to monitor Azure web apps is to link the web app to an Application Insights instance.
One or more web apps (and function apps) can optionally be linked to Application Insights and this is the primary way to get alert notifications on web app availability and performance.
Smart Detection rules
By enabling Smart Detection alert rules, you will receive alerts in these categories:
- Failure Anomalies: Uses machine learning to set the expected rate of failed requests for your app, correlating with load, and other factors. Notifies if the failure rate goes outside the expected envelope.
- Performance Anomalies: Notifies if response time of an operation or dependency duration is slowing down, compared to historical baseline. It also notifies if an anomalous pattern in response time, or page load time is noted.
- General degradations: Issues like Trace degradation, Memory leak, Abnormal rise in Exception volume, and Dependency Degradation
Smart Detection rules in Application Insights are keyed principally to metric data on the number of exceptions and failures, and the timeliness of page views and transactions. These alerts provide accurate, high-level, and aggregated surveillance of application health. They are not, however, real-time alerts of issues in progress. Smart Detection rules actually fire just once per day and look back 24 hours.
Availability web tests
You can also enable Availability web tests in Application Insights and perform URL ping tests to get alerting when web sites become unavailable. These alerts will let you know in real time when an app is down or otherwise inaccessible.
Other than the smart Detection Rules and any Availability web tests you may have set up, there are no other built-in alerting features.
Custom rules in Application Insights
You can (and perhaps should) create some additional alert-generating performance rules in your Application Insights instance, such as alerting when page load time significantly exceeds an expected average value. Figure 2 shows the first few of 30 built-in Application Insights signals that can be selected to alert on in real time.
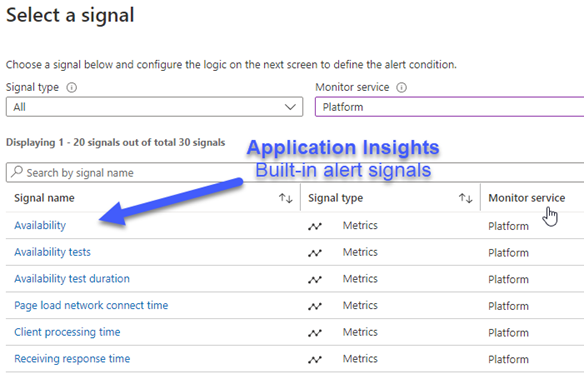
Figure 2 – Built-in Application Insights signals that you can create alerts from.
Custom rules in the App Service
In addition to being able to create custom rules based on signals in the Application Insights resource, there are also numerous metric signal options to craft custom rules from in the App Service (web app) instance itself. Figure 3 shows the first few of 36 built-in App Service signals that can be selected to alert on in real time.
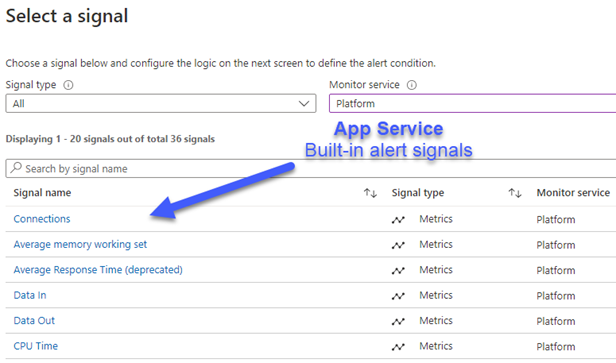
Figure 3 – Built-in App Service signals that you can create alerts from.
Enable Diagnostic Logging for your web apps
If you want to have observability of web app operations beyond what is provided with Application Insights, a next step is to turn on diagnostic logging for your web apps. Turning on diagnostic logging for app services is a recommendation of Defender for Cloud workload protection for Azure App services (see Figure 4), so this might already be turned on in your environment.
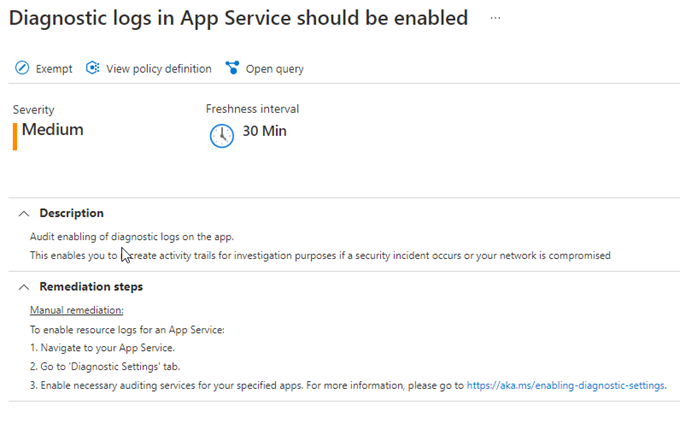
Figure 4 – Defender for Cloud workload protection for app services recommends enabling diagnostic logs.
Enable Diagnostic logs manually
If you have a small number of web apps, you can enable the diagnostic setting manually as shown in Figure 5, it does not matter what name you give the diagnostic setting. The App Service Application Logs are the key log needed to detect app service restarts, however from a security perspective, it’s a best practice to enable all the logs (except for Metric logs).
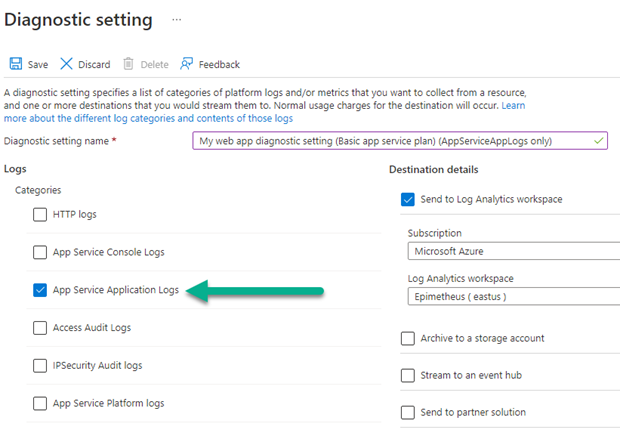
Figure 5 – Minimum diagnostic log setting needed to alert on web app restarts.
Enable Diagnostic logs with Policy
In a larger environment, or as a governance best practice, enable diagnostic logging on your web apps using Azure Policy. Then you can manage compliance with logging objectives though the compliance features of Azure Policy as seen in Figure 6. (See my previous article Azure policy initiatives for Microsoft Defender for Cloud and Microsoft Sentinel workload protections.)
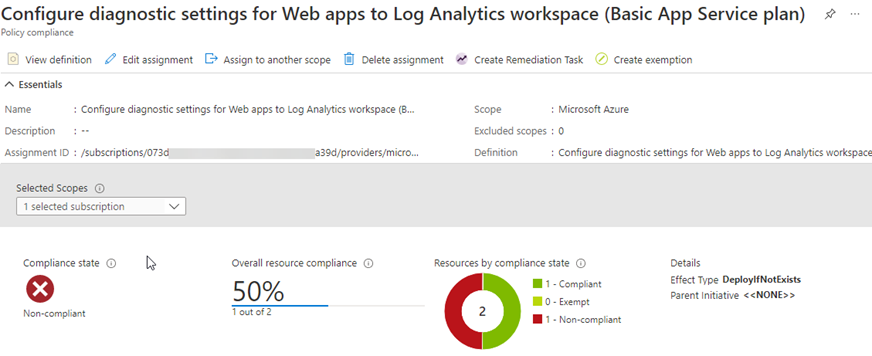
Figure 6 – Azure Policy is the recommended way to deploy and enforce web app diagnostic logging at scale and for governance purposes.
There is not a built-in (Microsoft-supplied) policy definition for Azure web app diagnostic logging. However, there is a supported method for modifying other PaaS apps’ diagnostic policy definitions to suit any Azure resource with a diagnostic log setting. I have done that work to create policies for web apps in Basic and Premium App Service plans and stored copies for reference in GitHub:
Azure Policy definitions
GitHub link: Configure diagnostic settings for Web apps to Log Analytics workspace (Basic App Service plan)
GitHub link: Configure diagnostic settings for Web apps to Log Analytics workspace (Premium App Service plan)
To use these policies, create a custom policy definition in the App Service category with the Name, Description, and Policy Rule found in the GitHub content. Assigning the polices will grant the Log Analytics Contributor and the Website Contributor roles to the service principal (System assigned managed identity) performing compliance remediation.
TIP: If your web apps are monitored by Microsoft Sentinel
If you are changing the diagnostic log settings of existing resources, and you have deployed Microsoft Sentinel as your SIEM, let your security staff know before making changes. The Azure Diagnostic settings removed from a resource analytics rule will be triggered and will produce a security incident as seen in Figure 7.
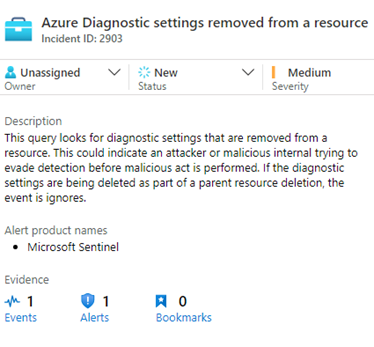
Figure 7 – Microsoft Sentinel creating an incident when the diagnostic settings on an Azure resource are removed.
Create Azure Monitor alert rule(s)
You will know that the log data necessary to alert on web app restarts has arrived in your Azure Log Analytics workspace when you see the AppServiceAppLog table show up as seen in figure 8:
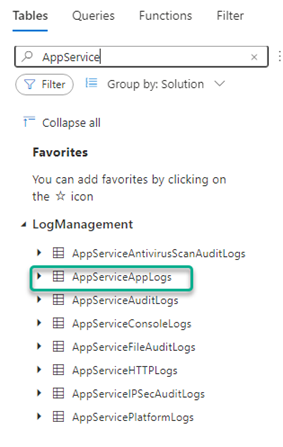
Figure 8 – Azure Log Analytics data tables added by App Service diagnostic logging.
The specific event we are looking for in the AppServiceAppLogs table, that signals an app restart occurred, is this one (seen in Figure 9):
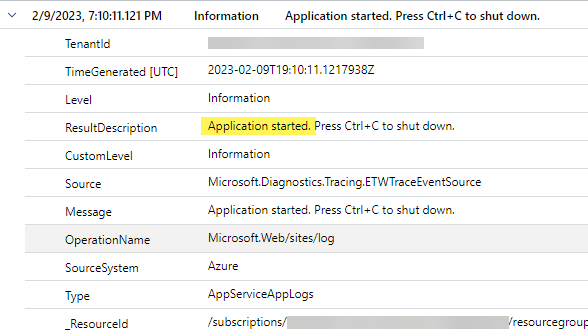
Figure 9 – An Application started event for an Azure web app.
The KQL query used to create an Azure Monitor Alert rule is this:
AppServiceAppLogs
| where Source == "Microsoft.Diagnostics.Tracing.ETWTraceEventSource"
| where ResultDescription has "Application started."
Once the AppServiceAppLogs data is present in your Log Analytics workspace, you can create alert rules on web app operations. I have crafted a sample Azure Monitor alert rule for reference in GitHub:
Azure Monitor Alert Rule Definition
GitHub link: A web app in the My resource group has restarted
To use this alert rule, create a new Alert rule in Azure Monitor of the Custom log search type. The sample rule is designed to be focused on web apps in one resource group. Use the settings in the reference from GitHub, modified to fit your environment.
Alert name: A web app in the <My resource group> has restarted
Description: This rule checks every 5 minutes for logged restarts of Azure web apps in a particular resource group and alerts if any were found during the previous 5 minutes. A separate alert is raised for each web app in the resource group meeting the alert criteria.
Evaluation frequency: 5 minutes
Windows size: 5 minutes
Count: GreaterThan 0
Also be aware that if a particular app restart event produces multiple log entries, all those events occurring within 5 minutes will be gathered in one alert. If multiple restart log events in the same resource group span two 5-minute windows, 2 alerts may be received for the same incident. Figure 10 illustrates the email alerting product of this solution that will be received by app stakeholders in real time every time a web app restarts for any reason.
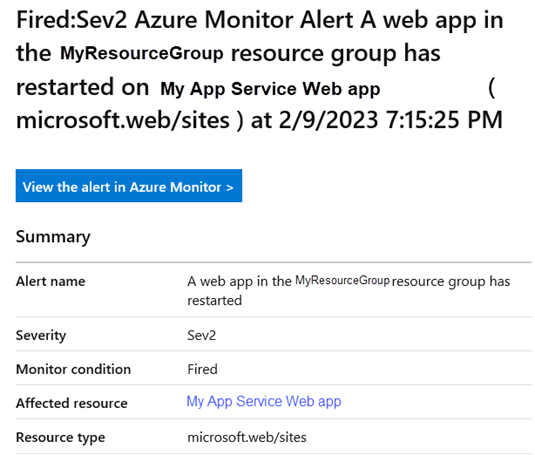
Figure 10 – Objective achieved: Real-time alerting form Azure Monitor every time a web app restarts.
 Gain a competitive advantage for your company and your career, get a copy of my book: (co-authored by Microsoft’s Steve Buchanan)
Azure Arc-Enabled Kubernetes and Servers: Extending Hyperscale Cloud Management to Your Datacenter
https://www.amazon.com/Azure-Arc-Enabled-Kubernetes-Servers-Hyperscale/dp/1484277678
Tags: #MVPBuzz #AzureMonitor #ApplicationInsights #AzureWebApp #webapp #monitoring #observability #DefenderforCloud #MicrosoftSentinel